

Zilei Yi
Last month we were pleased to welcome a new addition to the Team, Zilei (Chris) Yi, our new Chinese-speaking Sales Coordinator who recently graduated from the University of Bristol with a MEng in Aerospace Engineering.
Chris has been working hard learning the ropes and beginning to expand our operations into China. He also kindly treated our team to rice crackers (旺旺雪饼) during the Chinese New Year’s celebrations earlier this month – a welcome treat to hungry stomachs before our lunch break!
Alongside snack-dispensing, Chris has read a plethora of AFM research by Chinese scientists during his first month. In this blog, he shares his favourite Chinese AFM research papers, new and old, and from a variety of disciplines.

Read on to learn what papers Chris has been reading…
Contents Table
1. Drug-induced changes of topography and elasticity in living B lymphoma cells
2. Design and measurement of AFM probe based on MEMS resonator
3. Relation between micro-pore structure of shale and analytical gas volume
4. AFM imaging of a single immunoglobulin G molecule
5. Effect of perovskite grain boundary heterogeneity on photovoltage

1. Drug-induced changes of topography and elasticity in living B lymphoma cells
Atomic force microscopy (AFM) allows scientists to characterise the surface topography and biophysical properties of living cells, however a lack of adequate cellular immobilisation methods had meant AFM imaging of living, suspended mammalian cells was challenging.
Therefore, Li et al. (2012) devised a method of immobilising individual B lymphoma cells by combining mechanical trapping with pillar arrays and electrostatic absorption with poly-L-lysine.
This allowed them to measure Rituximab-induced changes to cell topography and elasticity. Specifically, 0.2 mg mL-1 Rituximab for 2 hours increased cell surface corrugation and reduced Young’s modulus from 196 to 183 kPa. Effects were more pronounced with 0.5 mg mL-1 Rituximab for 2 hours where cell topography changed more notably to include tubercles and Young’s modulus decreased significantly from 234 to 175 kPa.
To learn more about Li et al.’s (2012) paper click here: Drug-induced changes of topography and elasticity in living B lymphoma cells based on atomic force microscopy (2012).

Figure 1. “AFM images of the topography changes of a trapped B lymphoma cell stimulated with 0.5 mg.mL^-1 Rituximab (a) topography image of a cell; (b) amplitude image of a cell; (c) three-dimensional topography image of a cell; (d) topography image of a local area before Rituximab stimulation; (e) amplitude image of a local area before Rituximab stimulation; (f) topography image of a local area after Rituximab stimulation; (g) amplitude image of a local area after Rituximab stimulation” (Li et al., 2012).
2. Design and measurement of AFM probe based on MEMS resonator
Zhuang and Legrand (2015) have designed an AFM probe that overcomes some of the shortcomings existing AFM probes exhibit. These issues include low imaging speed, poor imaging in liquids, low Q value, and difficulty exceeding a resonant frequency of 3.5 MHz.
The researchers developed and fabricated a novel oscillating probe based on an I^2-shaped microelectromechanical-based (MEMS) resonator. The imaging capabilities and force sensitivity of the new probe were improved further by designing a resistance differential detection method which effectively eliminates the feedthrough coupling effect locally between driving and sensing. A local ion implantation method at maximum strain locations also improves the transmission efficiency of piezoresistance sensitivity.
Subsequently, experimental results showed that the probe fabricated with the new method increased force sensitivity by more than ten times.
Read more of Zhuang and Legrand’s (2015) paper here: Design and measurement of AFM probe based on MEMS resonator (2015).
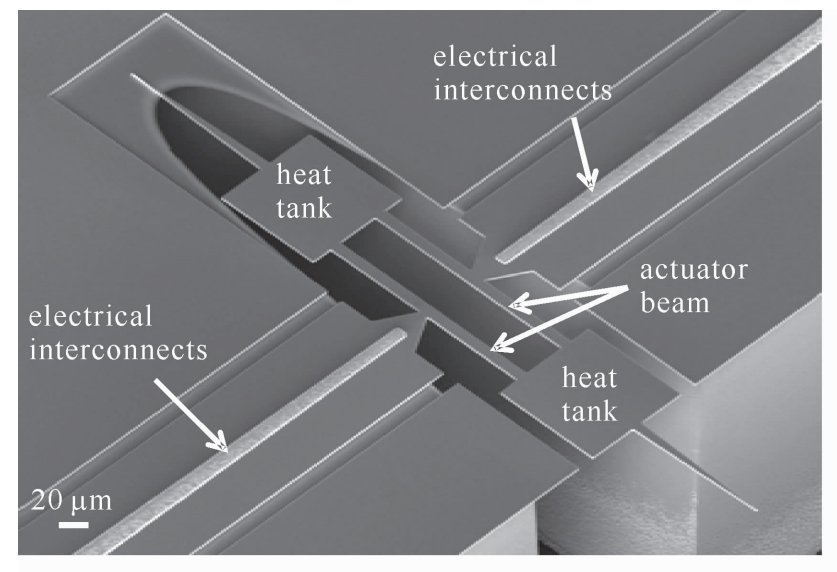
Figure 2. “SEM image of the I^2 shaped oscillating AFM probe” (Zhuang and Legrand, 2015).
3. Relation between micro-pore structure of shale and analytical gas volume
Atomic force microscopy (AFM) can be used to characterise the internal micro-structure of rock samples from shale reservoirs.
Specifically, Yongqiang et al. (2016) were able to determine a relationship between the morphological features of shale gas rock samples and the amount of field analytic gas that could be extracted. They used AFM to obtain three-dimensional topographies of the samples which showed the pore distribution and internal reservoir space.
The researchers found that typical samples from Jiaoye 1 well showed more intensive reservoir spaces and higher porosity compared to samples from Yucan 4 well, which is more beneficial for gas storage. They also showed that there is a positive correlation between the fluctuation degree of interspace and the amount of field analytical gas.
To find out more about Yongqiang et al.’s (2016) paper click here: AFM Based Pore Characterization of Shales and Its Relation to the Analytical Gas (2016).

Figure 3. “Three-dimensional appearances and pseudo colour stereograms of the JY1 - 2 410.5 m sample in different scanned areas by AFM”. The numbered areas shows pores within the sample. In (c) and (c) the areas 1 and 2 are particularly pronounced (Yongqiang et al., 2016).
4. AFM imaging of a single immunoglobulin G molecule
Zhao et al. (2016) have devised a way to detect and measure biomolecules at the single-molecule level using AFM. They specifically looked to characterise immunoglobulin G (IgG) adsorbed on a mica surface in liquid, which is a simple and convenient method.
Self-assembled DNA origami, in both triangular and rectangular shapes, had digoxin molecules modified on their surfaces. Consequently, this allowed an antigen-antibody complex to form with individual IgG molecules.
DNA origami’s adsorption characteristic meant individual antibodies could then be selectively adsorbed on the mica surface and imaged using AFM. This allowed the characteristic ‘Y-shaped’ domains of a single IgG molecule to be resolved in liquid.
Learn more about Zhao et al.’s (2016) paper using the following DOI: 10.11895/j.issn.0253-3820.160143.

Figure 4. “Images of individual IgG molecules. (a) AFM image of single IgG molecular binding to the triangular-shaped DNA origami; (b) enlarged AFM image in (a) marked with white square. The top: AFM image of single IgG molecule; the bottom, the project image of the IgG in (b) marked yellow” (Zhao et al., 2016).
5. Effect of perovskite grain boundary heterogeneity on photovoltage
Polycrystalline perovskites are used in semiconductors, a material which has an electrical conductivity somewhere between a conductor and an insulator. The grain boundary of perovskites isolates grains and determines the optoelectronic properties of the semiconductor and subsequently solar cell’s photovoltaic performance.
Perovskites are often treated as homogenous in the photoactive layer, particularly because the intragrain length scale is difficult to quantify. By using photoconductive AFM, Yao et al. (2021) studied the nanoscale through-film and lateral photoresponse of large-grained perovskite.
Specifically, they found the photocurrent collection along grain boundaries relies on the formation of adjacent grains, exhibiting grain boundary-grain boundary heterogeneity. Spatial heterogeneities can account for differences in photovoltage by up to 0.4 V between grains and grain boundaries. The researchers suggest this photovoltage loss originates from grain boundary shunting through the whole perovskite layer and that this issue can be alleviated by depositing a capping layer onto the perovskite layer.
Yao et al. (2021) explain this highlights the role of the inserted layer between the perovskite and electrode in real solar cells, meaning an understanding of grain boundary heterogeneity and its effect on photovoltage is crucial to optimising perovskite-based solar cells.
To learn more about Yao et al.’s (2021) paper please click here: Dependence of the heterogeneity of grain boundaries on adjacent grains in perovskites and its impact on photovoltage (2021).

Figure 5. “(a) Topography image, (b) amplitude image, (c) local current mapping under 100 mW.cm^-2 photoexcition” (Supplementary Information - Yao et al., 2021).
If you are a scientist working with AFM and are looking for some new AFM probes to try, please do not hesitate to get in touch with our Sales Coordinator Chris at zilei@nunano.com or by phone on + 44 (0) 117 299 3093.
If you enjoyed this blog post you might also like Top 7 AFM Papers of 2021 or Around the World with AFM in 5 Papers.
